Duplicate Analytics Dashboard
Learn how to use the Duplicate Analytics dashboard to monitor duplicate trends, track merge history, and measure data quality improvements over time. This tutorial walks through navigating the dashboard, understanding trend charts, reviewing audit logs, and exporting analytics reports for stakeholders.
What You'll Learn
- Navigate the Duplicate Analytics dashboard and switch between custom date ranges
- Read the four headline metrics: Total Found, Total Merged, Auto Merged, and Pending
- Use the ROI Calculator to translate merges into hours saved and dollars saved
- Interpret the By Rule, By Processing Type, and Weekly Trend charts
- Spot data quality drift early using the weekly found-vs-processed dynamics
Key Takeaways
- Auto-merged records cost zero manual time — track this number to justify automation investment
- The Pending bucket is the leading indicator of cleanup backlog
- Per-rule charts show which matching rules generate the most duplicate work
- Custom date ranges let you measure the impact of a specific cleanup initiative
Frequently Asked Questions
How far back does the Duplicate Analytics dashboard go?
By default the dashboard shows the last 3 months. You can switch to a custom date range to look at any period — for example, a single quarter, a specific cleanup sprint, or year-over-year comparison.
Does the ROI Calculator save my inputs?
Yes. The minutes-per-duplicate and hourly-rate inputs are saved per user, so you only need to enter them once. The savings are recalculated automatically whenever the date range changes.
Why are my Auto Merged numbers low?
Auto Merged only counts records that were merged automatically by an auto-merge rule. If your matching rules are scan-only, all merges show up as Manual Merged. Enable auto-merge on the rules you trust to grow this number.
Can I export the analytics for a board report?
Yes. Each chart can be exported, and the underlying merge audit log can be queried directly in Salesforce reports for custom dashboards or scheduled email reports.
More Videos
No Duplicates: Application Overview
Complete walkthrough of No Duplicates for Salesforce. Learn how to install and configure the app, create matching rules for Accounts, Contacts, and Leads, run duplicate scans, and review results. The video also covers setting up auto-merge strategies and scheduling recurring duplicate checks to keep your data clean automatically.
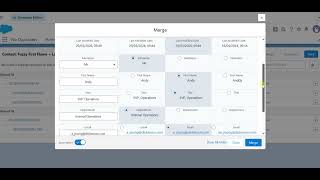
Auto-Select for Merge
Learn how Auto-Select pre-fills the merge modal with recommended field values based on your configured merge strategies. See how the modal opens ready to merge, how to review and adjust recommendations, and how Auto-Select connects to your Auto-Merge rules.
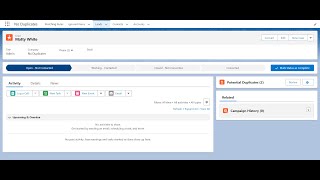
Potential Duplicates Component
Explore the Potential Duplicates lightning component that surfaces possible duplicate records directly on record pages in real time. Learn how to add the component to a page layout, review and compare potential matches, merge or dismiss duplicates, and customize display fields and detection thresholds.